While working on my ASP.NET Core Web API project, I faced a big problem debugging my code locally. In our cloud setup, I used Amazon CloudWatch to check logs, and finding issues was easy because I could search and filter them quickly. But on my local machine, it was tough—console logs were messy and hard to search. That’s when I found Seq. It made debugging so much easier by giving me a clear, searchable dashboard for logs, just like CloudWatch.
In this article, I’ll show you how to set up Serilog, a powerful logging library, and Seq, a log analysis tool, in an ASP.NET Core Web API project using .NET 8. I’ll use Docker to run Seq, set it up for debug mode, create endpoints to show different log levels (Information, Warning, and Error), and explain why this setup is great. By the end, you’ll have a simple logging system that makes debugging easy. You can find the full code on GitHub https://github.com/mrashutoshnigam/SerilogSeqDemo.
Why Serilog and Seq?
Serilog is a smart .NET library that saves logs as structured data, not just plain text, so I can easily search them. Seq is a server that shows these logs in a clean dashboard, making it simple to understand what’s happening in my app.
Using Serilog and Seq in development has many benefits:
- Structured Logging: Logs are saved in a way that I can filter by things like request ID or log level.
- Centralized Logs: Seq puts all logs in one place with a nice dashboard.
- Easy Search: Seq’s dashboard lets me search logs quickly, which saves time when debugging.
- Docker Setup: Running Seq in Docker is easy and works the same everywhere.
- Detailed Logs: Serilog adds extra details like request info or errors, which helps me find issues.
- Scalable: Seq is lightweight for local use but can work in production too.
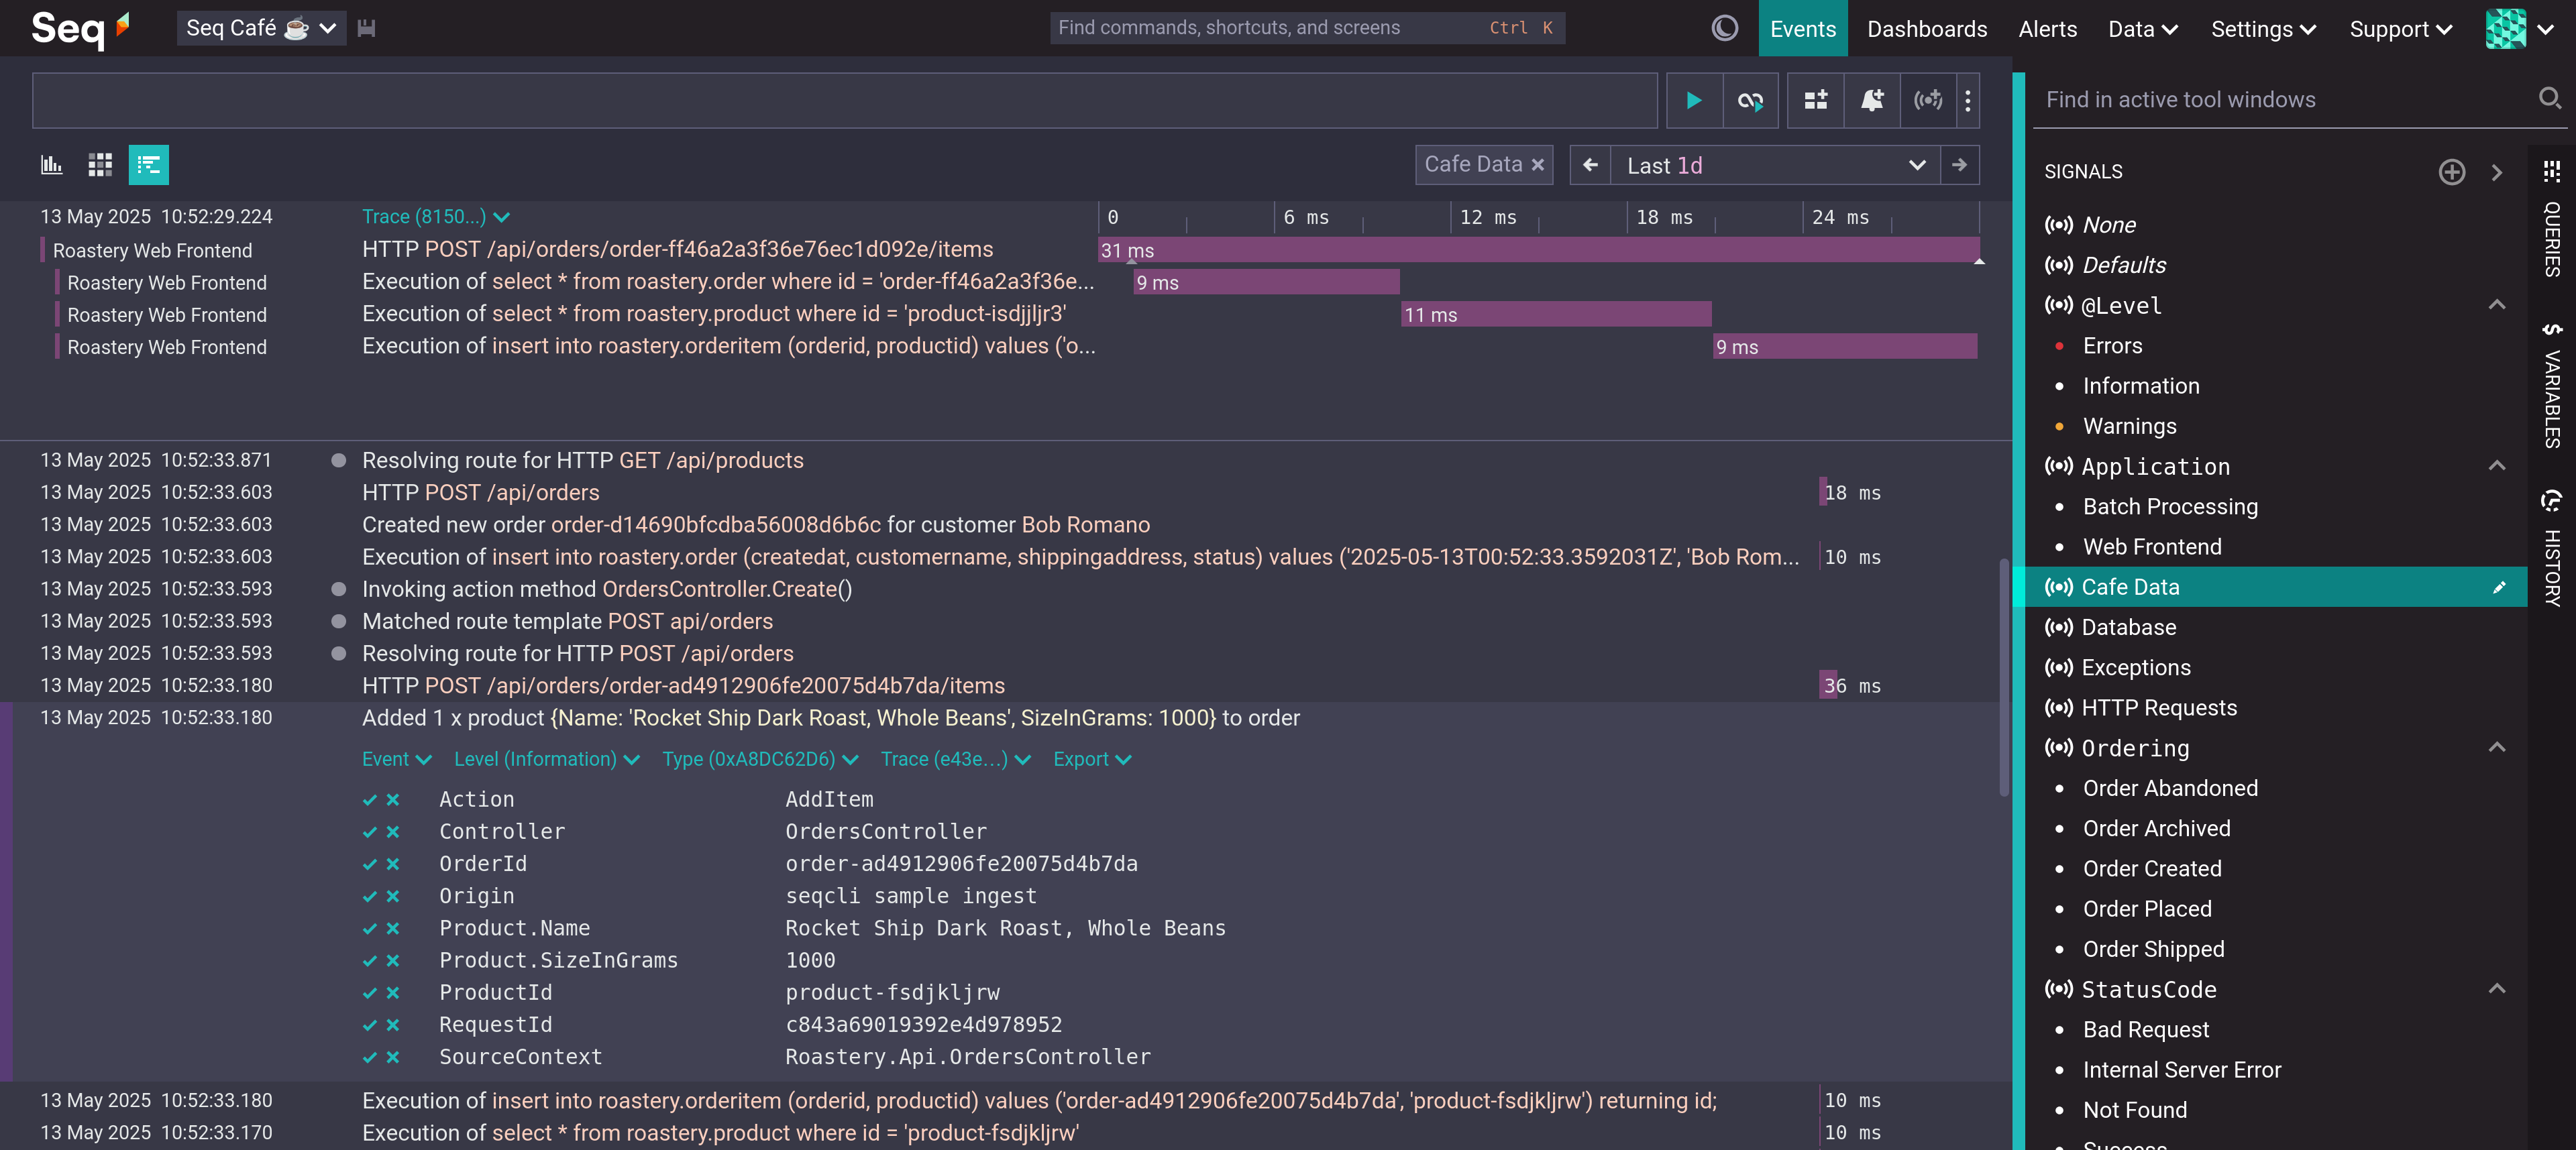
[Seq Dashboard Image Placeholder 1: Add a screenshot of the Seq dashboard showing the main log view.]
Let’s get started with the steps.
Step 1: Create a New ASP.NET Core Web API Project
I’ll start by creating a new Web API project in .NET 8.
- Open a terminal and create the project.
- Open the project in an IDE like Visual Studio or VS Code.
Use this command to create the project:
dotnet new webapi -n SerilogSeqDemo -f net8.0
cd SerilogSeqDemo
This gives me a basic Web API project with a sample WeatherForecast controller. I’ll add logging to it.
Step 2: Install Serilog and Seq Packages
To use Serilog and Seq, I need to install some NuGet packages.
- Run these commands in the terminal.
dotnet add package Serilog.AspNetCore
dotnet add package Serilog.Sinks.Console
dotnet add package Serilog.Sinks.Seq
dotnet add package Serilog.Exceptions
dotnet add package Serilog.Enrichers.Environment
dotnet add package Serilog.Enrichers.ThreadSerilog.AspNetCore: Connects Serilog to ASP.NET Core.Serilog.Sinks.Console: Shows logs in the console, great for local debugging.Serilog.Sinks.Seq: Sends logs to the Seq server.Serilog.Exceptions: Adds detailed error info, like stack traces.Serilog.Enrichers.Environment: Adds details like the machine name or environment (e.g., Development) to logs.Serilog.Enrichers.Thread: Adds thread IDs to logs, helpful for tracking tasks in my app.
Step 3: Set Up Seq in Docker
Seq is simple to run using Docker, which keeps things consistent. I’ll set it up for debugging, but it can also be used in production with extra settings.
- Make sure Docker Desktop is installed and running on my machine.
- Start a Seq container.
- Open a browser and go to
http://localhost:5341. I should see the Seq dashboard, which means it’s working.
docker run --name seq -d --restart unless-stopped -e ACCEPT_EULA=Y -p 5341:80 datalust/seq:latest- This pulls the Seq image from Docker Hub and runs it on port 5341.
ACCEPT_EULA=Yagrees to Seq’s license terms.- The container is named
seqand restarts automatically unless I stop it.
Step 4: Configure Serilog in the Web API
Now, I’ll set up Serilog to log to the console and Seq, but Seq will only work in DEBUG mode for development.
- Update the
Program.csfile to add Serilog to my ASP.NET Core app.
using Microsoft.AspNetCore.Builder;
using Microsoft.Extensions.DependencyInjection;
using Serilog;
using Serilog.Enrichers;
using Serilog.Events;

var builder = WebApplication.CreateBuilder(args);

// Set up Serilog
var loggerConfiguration = new LoggerConfiguration()
    .MinimumLevel.Information()
    .Enrich.FromLogContext()
    .Enrich.WithEnvironmentName()
    .Enrich.WithMachineName()
    .Enrich.WithThreadId()
    .WriteTo.Console();

// Use Seq only in DEBUG mode
#if DEBUG
    loggerConfiguration.WriteTo.Seq("http://localhost:5341");
#endif

Log.Logger = loggerConfiguration.CreateLogger();

builder.Host.UseSerilog();

builder.Services.AddControllers();

var app = builder.Build();

// Add Serilog request logging
app.UseSerilogRequestLogging();
app.UseHttpsRedirection();
app.UseAuthorization();
app.MapControllers();

app.Run();
MinimumLevel.Information(): Sets logs to show fromInformationlevel and above.MinimumLevel.Override: Reduces noise by setting Microsoft and System logs toWarning.WriteTo.Console(): Sends logs to the console for all environments.WriteTo.Seq("http://localhost:5341"): Sends logs to Seq, but only in DEBUG mode.Enrich.FromLogContext(): Adds context data to logs.Enrich.WithEnvironmentName(): Adds the environment name (e.g., “Development”).Enrich.WithMachineName(): Adds the machine name to logs.Enrich.WithThreadId(): Adds thread IDs to logs.UseSerilog(): Makes Serilog the main logging tool.UseSerilogRequestLogging: Logs details about HTTP requests, like path and status.
Note: I’ve set Seq for DEBUG mode to help with local development. For production, I can add Seq with a different URL and settings like API keys, as explained in the Seq documentation.
Step 5: Create a Sample Controller with Logging
I’ll create a controller with endpoints to show different log levels: Information, Warning, and Error.
- Create a file named
LogController.csin theControllersfolder.
using Microsoft.AspNetCore.Mvc;
using Serilog;

namespace SerilogSeqDemo.Controllers
{
    [Route("api/[controller]")]
    [ApiController]
    public class LogController : ControllerBase
    {
        private readonly ILogger<LogController> _logger;

        public LogController(ILogger<LogController> logger)
        {
            _logger = logger;
        }

        [HttpGet("info")]
        public IActionResult LogInformation()
        {
            _logger.LogInformation("Processing request to {Endpoint} for user {UserId}", nameof(LogInformation), "User123");
            return Ok("Information log recorded.");
        }

        [HttpGet("warning")]
        public IActionResult LogWarning()
        {
            _logger.LogWarning("Potential issue detected in {Endpoint}. Check configuration for {Setting}", nameof(LogWarning), "ApiKey");
            return Ok("Warning log recorded.");
        }

        [HttpGet("error")]
        public IActionResult LogError()
        {
            try
            {
                throw new InvalidOperationException("Simulated error in the system.");
            }
            catch (Exception ex)
            {
                _logger.LogError(ex, "An error occurred in {Endpoint} while processing request.", nameof(LogError));
                return StatusCode(500, "Error log recorded.");
            }
        }
    }
}
- The controller uses
ILogger<LogController>for logging. - The
LogInformationendpoint logs a message with details likeEndpointandUserId. - The
LogWarningendpoint logs a warning about a possible issue. - The
LogErrorendpoint creates a fake error and logs it with details.
Step 6: Run and Test the Application
- Run the project in DEBUG mode.
- Use a browser or Postman to call these endpoints.
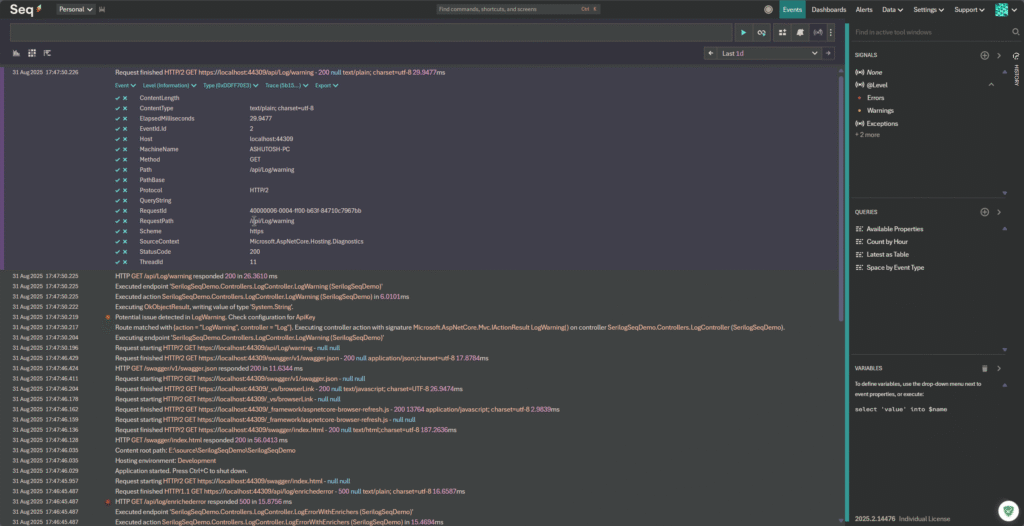
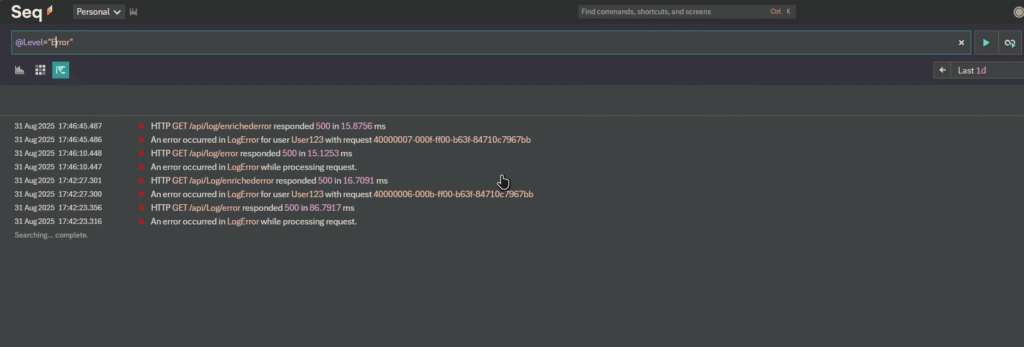
- Go to
http://localhost:5341to see the Seq dashboard. It should show logs for each request, including: - Use Seq’s search bar to filter logs, like typing
Level = "Error"to see only errors orEndpoint = "LogInformation"to find specific logs.
dotnet run --configuration DebugCall these endpoints:
https://localhost:<port>/api/log/infohttps://localhost:<port>/api/log/warninghttps://localhost:<port>/api/log/error
Logs will include:
- Information: Details about the
infoendpoint, with fields likeEndpoint,UserId,EnvironmentName, andThreadId. - Warning: A warning about an issue in the
warningendpoint. - Error: An error with a full stack trace from the
errorendpoint.
Step 7: Enhance Logging with Enrichers
I can make logs more useful by adding extra details using Serilog’s enrichers. The Serilog.Exceptions, Serilog.Enrichers.Environment, and Serilog.Enrichers.Thread packages add error details, environment info, and thread data.
- Update the
LogErrorendpoint inLogController.csto include more details. - Run the app in DEBUG mode and call the
errorendpoint. In Seq, I’ll see the error details, including the stack trace and fields likeUserId,RequestId,EnvironmentName, andThreadId.
[HttpGet("error")]
public IActionResult LogError()
{
    try
    {
        throw new InvalidOperationException("Simulated error in the system.");
    }
    catch (Exception ex)
    {
        _logger.LogError(ex, "An error occurred in {Endpoint} for user {UserId} with request {RequestId}", nameof(LogError), "User123", Request.HttpContext.TraceIdentifier);
        return StatusCode(500, "Error log recorded.");
    }
}
Benefits of Using Serilog and Seq in Development
Using Serilog and Seq in my .NET 8 Web API project makes development easier:
- Easy Debugging: Seq’s dashboard shows errors and warnings clearly, with colors like red for errors.
- Structured Data: I can search logs by fields like user IDs or request paths.
- Simple Setup: Docker makes running Seq easy, and the free license is great for local use.
- Works Everywhere: I can use the same setup in production with some changes.
- Fast Performance: Serilog and Seq don’t slow down my app.
- Flexible: Serilog works with other tools like files or Elasticsearch, and Seq connects to other systems.
Conclusion
In this article, I set up Serilog and Seq in my ASP.NET Core Web API project using .NET 8. I ran Seq in a Docker container for DEBUG mode and created endpoints to show Information, Warning, and Error logs. I used Serilog’s enrichers to add details like environment and thread info, making logs easy to search in Seq’s dashboard. This setup made local debugging as simple as using CloudWatch in the cloud.
The full code is on GitHub https://github.com/mrashutoshnigam/SerilogSeqDemo. To learn more, check the Serilog, Seq, and Docker websites. For production, I can add Seq with API keys and retention settings, as shown in the Seq documentation.
Happy logging!